| |
|
HISTOLAB™: For Simple Image Analysis
|
|
HISTOLAB™ is designed to provide easy to use image analysis tools for routine work. Forget complex menus, hard-to-read user’s manuals and specialist words.
Histolab allows you to do complex image analysis without the help of a specialist. Capture, archive, improve, detect, count, quantify, process, report and export images with easy to use tools. Histolab includes all of the most widely used tools in the Life Science lab.
|
|
| |
|
| |
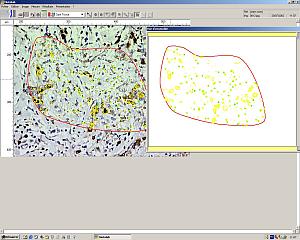
Define the Measurements
HISTOLAB™ allows you to quickly and simply define the parameters you wish to analyse : Zone of interest, cells, nuclei, structures, counting, measurements and quantitations. Each parameter will be automatically associated with its corresponding pre-defined data field. |
|
|
| |
|
| |
|
Define Automated Detection Protocol
A tutorial window will guide you through the definition of the detection protocol for the objects to be analysed. This can be done on a real time or archived image. Changes in detection parameters are immediately displayed on the image making fine tuning easy. The finalised detection protocol can be saved for repeated use.
|
|
| |
|
| |
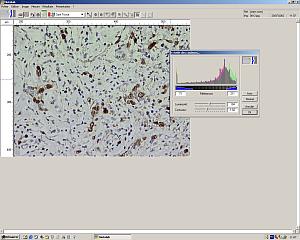
Improve Images
HISTOLAB™ provides a full palette of image improvement functions. These tools may be used to improve the image display for reporting reasons or to facilitate the automatic detection of objects by, for example, improving the contrast between objects to be measured and the background.
|
|
|
| |
|
| |
|
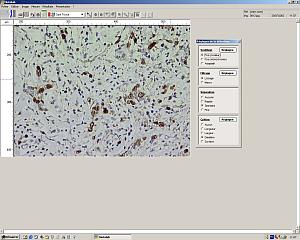
Automated Detection
The automatic detection protocol may be applied to the whole image or to selected zones. Multiple zones (ie. normal tissue, pathological tissue) can be selected, analysed and comparisons made.
The detection protocol can be applied to an archived or a real time video image. When working with a real time image and automated stage, various zones can be defined throughout the whole section. Data is analysed and only the zones of interest rather than the whole image can be stored to save disc storage space.
Whilst using an automated stage the software will recognise the position of the stage thus eliminating the risk of duplicate measurements. It also allows a global overview to be made.
|
|
| |
|
| |
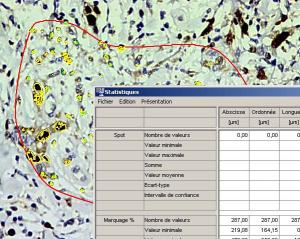
Processing the Data
The results are stored automatically into tables and processed for statistics (average, standard deviation etc) and graphs.
Each table and graph can be readily exported to an Excel spreadsheet for processing or reporting. Captured images can be associated with tables and graphs.
For many samples a scanning detection protocol can be applied to automatically scan the sample and collect the data. |

|
|
| |
| |
| |
|