| |
|
Automated Tissue Array Analysis Workstation |
| |
SPOT BROWSER V2e®
For simplified and fast analysis of tissue arrays.
Tissue arrays have become a popular way of studying large numbers of samples, whether you are looking at Morphology, immunohistochemistry or in-situ hybridization.
Analysis of numerous samples under a microscope is a long tedious process subject to operator error. Moreover data processing is complex due to the large volume of data to be analysed.
Spot Browser brings an elegant, simple and efficient solution to these problems.
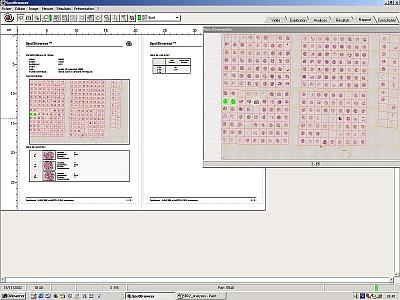
Spot Browser allows the user to rapidly scan the complete tissue array slide at low magnification. This image is then used as a ‘road map’. Analysis parameters are then set by the user, these will be displayed alongside each individual core as it is being analysed. Analysis can be done manually with the results directly entered into the analysis table or automatically. Once each core has been analysed results and images can be easily exported to other applications such spreadsheets or databases.
|
|
|
|
| |
|
| |
 |
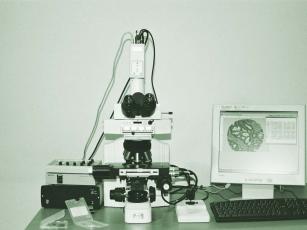
The SPOT BROWSER Workstation
SPOT BROWSER is an integrated and optimised workstation including:
An upright bright field microscope. ( Alternatively Spot Browser can be installed on an existing lab microscope)
A motorized 3 axis stage, with one slide position, remote control and joystick.
A high resolution digital camera.
A DELL workstation configured for high performance imaging complete with a 21’’ high resolution flat screen.
Whilst the workstation is designed for Tissue Array analysis it can be still be used for routine microscopy.
|
|
| |
|
| |
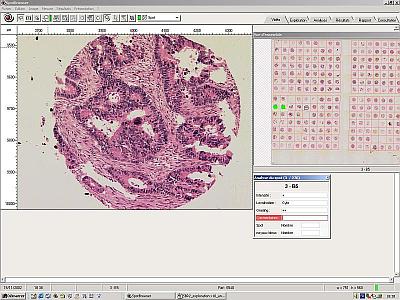
Using SPOT BROWSER
Spot Browser is designed to be completely flexible, allowing the user to set exactly which parameters they wish to record. Different sets of parameters can be stored for different studies.
- Identify your slide, the study and the operator. This data will be recorded alongside each spot recorded.
- Create data input fields. These fields will be displayed in a table alongside each individual spot displayed on the screen. The user will score the array and enter the data into this table. Data can be entered either as ‘free text’,or list mode. Data imported from other files which relates to the individual spot, i.e. patient number can also be displayed in the table. If during scoring the user decides that more data needs recording this table can be changed and additional fields added.
- Scan your array slide at low magnification. This image can then be displayed on the screen at all times and is used as a roadmap. Simply clicking on any spot will automatically move the stage to that spot.
- Define a grid pattern to determine in which order you wish to read and number the array. Once this grid is defined the Spot Browser will automatically detect the spots, thus compensating for mis-aligned spots or curves in the array.
- Select a higher magnification and move to the first spot to be analysed. The high magnification image is displayed on the screen, alongside the analysis table for completion and the roadmap which indicates which spot is currently displayed.
Enter the scoring data and save this alongside the image. |
|
| |
|
| |
 |
Results and image archiving.
Results of tissue array analysis and tissue spot images are archived into tables which ensure the tissue spot ID for guaranteed tracking.
The database can be easily exported to Excel sheets or to .csv or .txt files. |
|
| |
|
| |
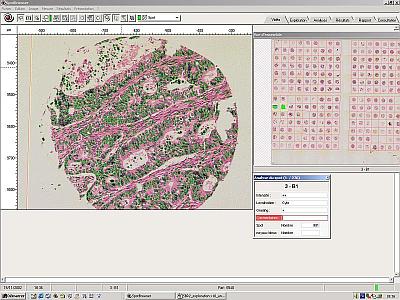
Automated detection of events
Most users choose to read each spot manually. However Spot Browser can be used completely automatically. The slide is simply placed on the stage, it is automatically scanned and the spots detected.
Automated detection parameters are then selected such as nuclei detection, colour detection, size differentiation, signal quantitation. These parameters can be fine tuned in real time on any of the spot images displayed. Once the user is happy with the parameters the Spot Browser scans the whole slide, each spot is read, and the results are recorded alongside the captured image. These results can be subsequently reviewed and adjusted if required.
|
 |
|
| |
|
| |
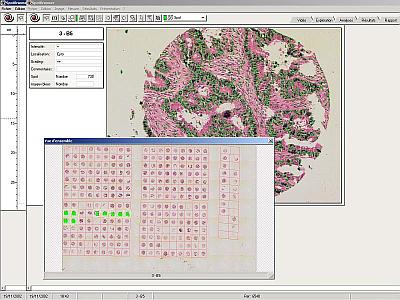 |
Analysis results and Spot images review
Tissue array results and spot images can be reviewed at any time after analysis has occurred.
Reviewing a tissue array analysis with the original slide under the microscope allows rapid relocation of the spots through the dynamic link between tables and spot position. This allows the user to visualise the spot together with the results previously recorded for possible modification.
Alternatively the images and results can be reviewed and edited on a remote workstation without access to the original slide. |
|
| |
|
| |
Audit Trail
An audit trail report tracks all analysis data and captured images and can be printed at any time. |
 |
|
| |
| |
| |
|